The Power of the Electric Meter
One of the few improvements we made to our house after moving in was to replace the roof and to install a solar array. I love the environmental aspect of solar, as well as the prospect of cheaper electricity, but perhaps the coolest aspect of the solar system is the ability to monitor its energy production through an app or website. And, as I later learned, it could also tell me how much energy I was consuming. Unfortunately, getting that information proved tricker than I thought.
When we first got the system set up, I could easily see how much energy the panels were consuming. Even on the shortest winter days, we produced 40 or more kilowatt hours of power. It was really cool to see the energy being produced by each panel and how that changed over time.
But how did that compare to what we were consuming? On average, an American home consumes somewhere around 30 kilowatt hours a day, but that can vary greatly based on how a house is heated or cooled, the time of year and the temperature outside.
I could, of course, look at our electric meter, but that wasn't super easy. The meter just shows how many total kilowatt hours I've used as a running total (11,415 kWh, bottom left), so I'd have to remember what it was the day before and note the difference. And the meter isn't in a location I go to often. On the plus side, it would also show me how much electricity I had exported from the solar panels (291 kWh, bottom right). But again, that is a running total and so a bit of a pain to check.
I could also wait for our electric bill where it was easy to see the daily average for the billing period. For instance, in October, we were a bit higher than that 30 kilowatt hour a day average figure — more like the upper 40s. But in December, that figure had skyrocketed — thanks in large part to our baseboard heaters and their old thermostats — to levels too embarrassing to put in print.
I didn't like having to wait until the end of the month to see a shocking bill and discover how much energy I was consuming. I wanted to be able to monitor it in real time so I could make choices to save money and the environment. And I noticed that the solar app had a feature to do just that — but apparently my system wasn't set up for it.
An old This Old House episode told me of the ability to do this with a cool device that clamped on to the electric panel — which not only lets you know your total consumption, but breaks it out by every device drawing current — but it costs several hundred dollars and wouldn't integrate with my solar system. After doing some research, though, I learned that similar equipment could be integrated with my system and would tell me just what I wanted to know.
The problem was, though the devices themselves were just $50, my solar company wanted to charge me $800 to install them. Given that the devices simply clamp around the electric cables and then plug into the solar computer, that struck me as outrageous. I figured I could do it myself.
There was just one catch. Because the devices clamp around the cables between the meter and my main breaker, I'd be working with lines that I couldn't shut off — they'd always be powered from the grid. In other words, they were live and drawing a shit-ton of power and I could electrocute myself. I mean, I probably wouldn't. But I could.

It's worth understanding how the meters work. They are essentially magnets in the shape of a donut that clamp around an electric cable. As electricity flows through the cable, the power energizes the magnets. The more power that flows through the cable, the more the magnets are energized. By measuring how strongly the magnet is energized, we can calculate how much energy is flowing through the cable. To do that, a wire connects the donut magnets to the solar system, which then reports out the results.
What that means is that I had to attach the meters — the donut magnets — to the main electric cables and then route the meter's wiring back to the solar system. It was this wiring that the solar company wanted to charge me $800 to do.
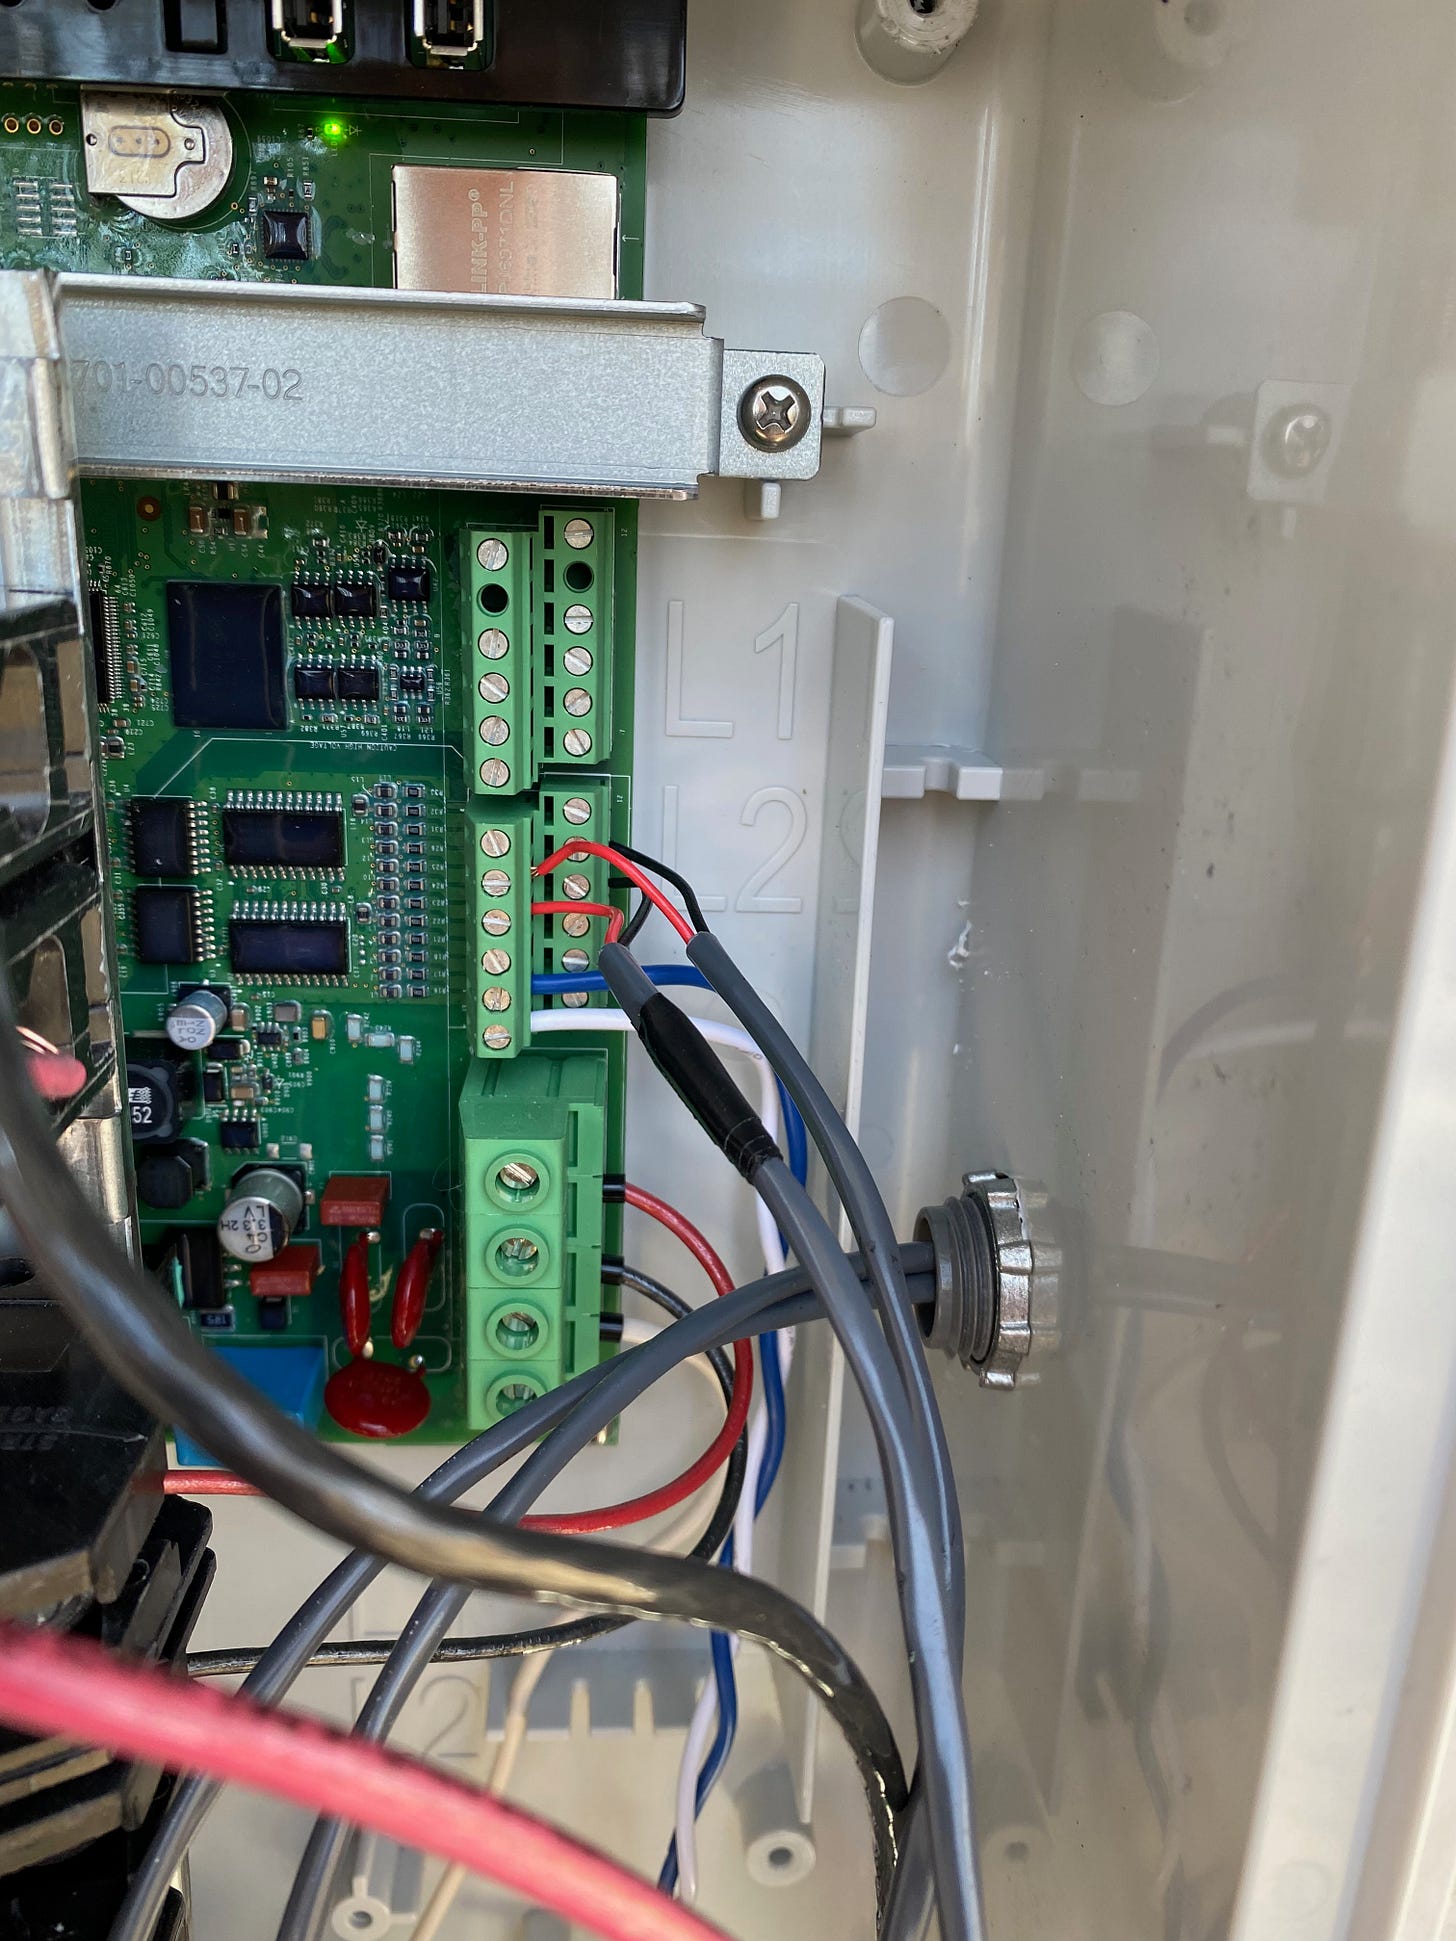
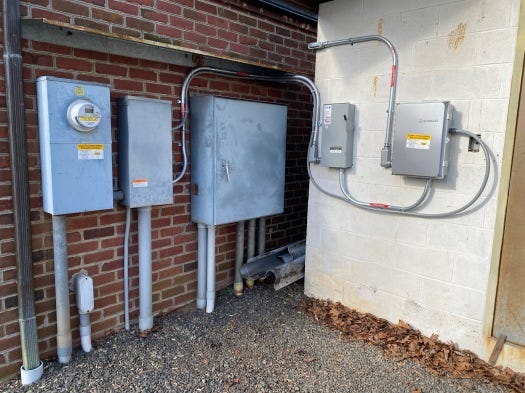
In theory, the wiring was really straightforward. Each meter has two wires that plug into the solar system's computer board. In fact, the solar system's main computer even has wiring diagram stickers in the unit showing where the wires go. The problem for me was that the solar computer and the main lines are not next to each other. In fact, they are mounted to different (though adjacent) buildings with conduit connecting other power-carrying cables between then.

What I would have liked to have done — and what I thought I might be able to do — was to thread the long wires of the consumption meters through the existing conduit. This would keep everything neat and tidy, but alas, the conduit was already chock-full of cables delivering all of the power from my solar system to the house. There wasn't any room for me to pull the meter's wires through.
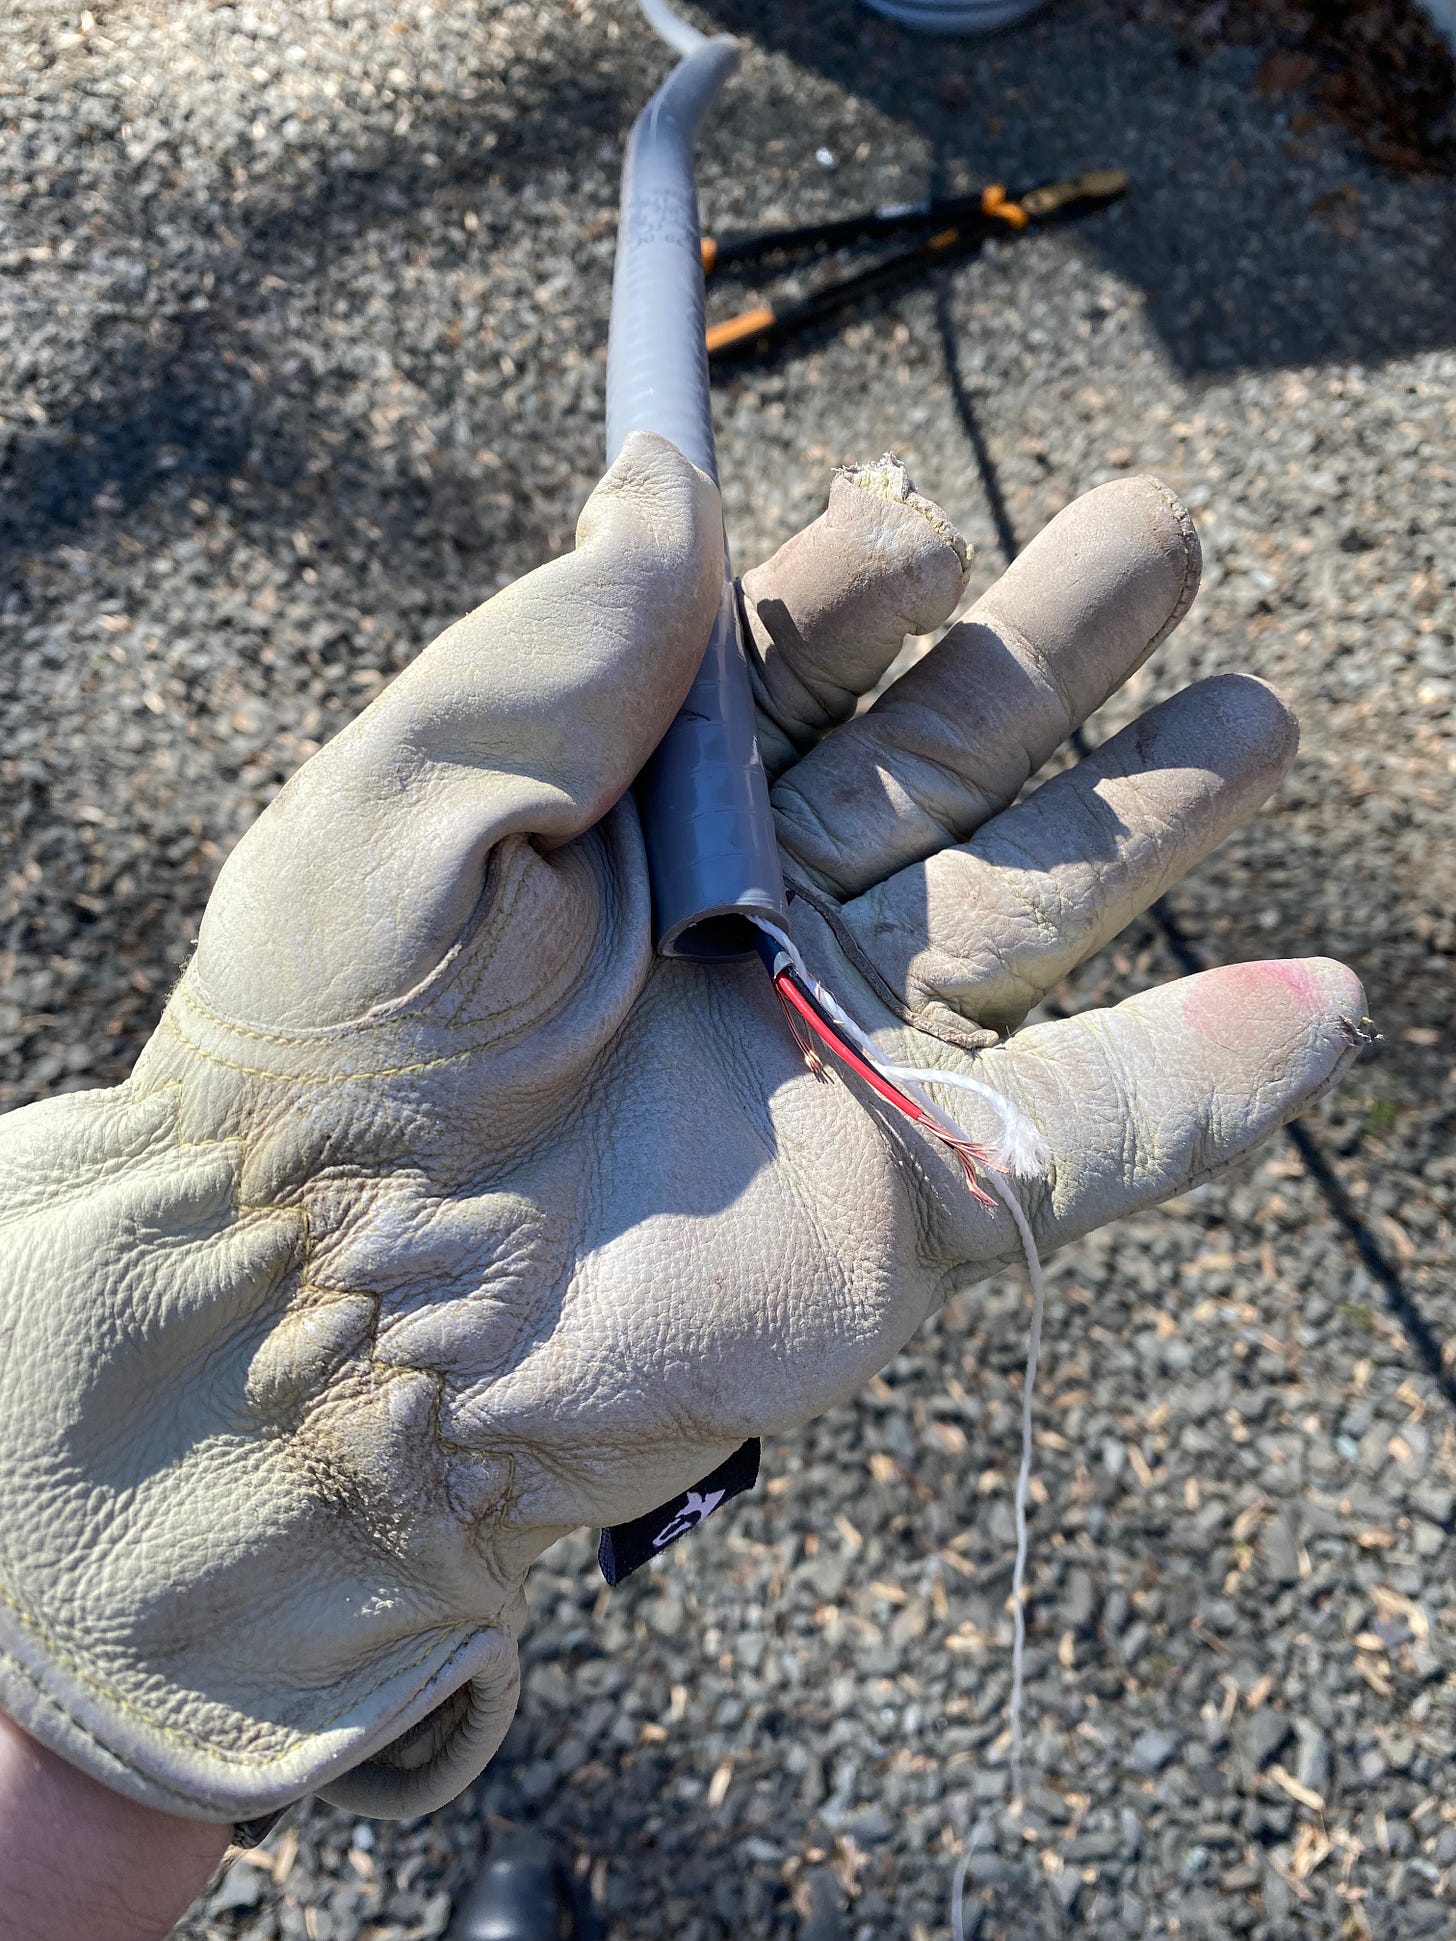
Instead, after turning off the power to the panels and my house — but, and I can't stress this enough, unable to turn off the power from the meter to the first panel, meaning those big cables were still energized — I threaded the meter's wires through flexible conduit, drilled new holes in the main panel and in the solar computer box, and then attached the conduit to each box. To clean it all up, I used zip ties to hold my flexible conduit to the previously mounted steel conduit that carries power.
Having wired everything, I closed the boxes, turned on the power up and turned to my app. Would it show how much energy I was consuming as well as producing?
Yes! I could now see not just the solar production, but also my consumption and how the power was divvied up. In the above example on the left, the app shows I consumed 106.4 kWh on Feb. 28. (Ouch!) Meanwhile, I generated 52.1 kWh from my panels and also imported 82.2 kWh from the grid for a total of 134.3 kWh, which is obviously more than the 106.4 kWh I used. So what happened?
The graph on the right explains. There were periods (like, you know, when it was dark outside) when I didn't produce any energy (blue), but I did consume energy (orange). During those times, I imported all of my power from the grid. Then there were times, like the early morning, when I produced a little energy, but I consumed a lot more. During those times, I consumed all the power I produced but because that wasn't enough to meet my demand, I imported the rest. Then during the middle of the day, I was producing way more than I was consuming. So, whatever I didn't use, I sent back to the grid. Then the sun went down and I was back to producing nothing while still consuming power for things like lights, heat, cooking, and blog writing, which meant I was once again importing power from the grid.
For the day, there were 28.0 kWh of power I produced that I didn't immediately consume, and therefore sent back to the grid, for which I received credit. In the end, the electric company will charge me for the 54.3 "net imported" kWh for the day. (If you're thinking, wait, you consumed over a 100 kWh of electricity and the average house consumes less than 30?? True, but most houses aren't heated by electric power — they use gas or oil. But we are solely electric, so while our electric use is much higher than average, we have no other utility costs.)
So now I have clarity on exactly how much energy I'm producing and consuming as well as the mix of energy importing and exporting and can, I hope, better manage my electric use. All without paying $800 to do some simple wiring. Now I can focus on finding ways to trim our electric use.


